The Harper Adams and BASE-UK Conservation Agriculture Systems Experiment.

Joe Collins
Senior Research Associate
Conservation Agriculture (CA) manages farms to boost productivity while protecting soil health. In this blog, I’ll outline the experiment’s setup, highlight key results, and show how it has supported other research, including work with the Earth Rover Program.

Hi all, I’m Joe
I am research scientist for the Earth Rover Program and Harper Adams University in Shropshire, UK. I’m an agricultural scientist interested in farming systems, soil science, and agronomy. Prior to my career in science, I was a farmer and have worked in the arable and livestock industry in the UK and abroad doing a wide variety of jobs from driving combine harvesters to sheep shearing. My interest in agronomy grew over the years and led me to do a PhD at Harper Adams University with Professor Simon Jeffery. Simon and I are interested in how conservation/regenerative farming practices are implemented on farms in a real-world scenario and how they affect the soil and the agroecosystem. As part of my PhD, I started an experiment called the Conservation Agriculture Systems Experiment which has now continued post my studies with generous support from BASE-UK, an independent, farmer-led knowledge exchange network of over 500 farmers in the UK dedicated to regenerative agriculture.
In this blog, I will describe the premise of the experiment, run quickly through some of the standout results, and focus on how the experiment has been host to many other researchers and their work over the years, including the Earth Rover Program

Figure 1 - Harper Adams University and BASE-UK Conservation Agriculture Systems Experiment. Source: Authors own.
What even is Conservation Agriculture?
Conservation Agriculture (CA) is an agricultural system designed to manage agroecosystems for improved and sustained productivity by conserving and enhancing soil quality and biota. Despite widespread promotion and adoption in various regions globally, the effectiveness and sustainability of CA remain topics of ongoing debate and investigation. The three principles of Conservation Agriculture are shown below in Figure 2.
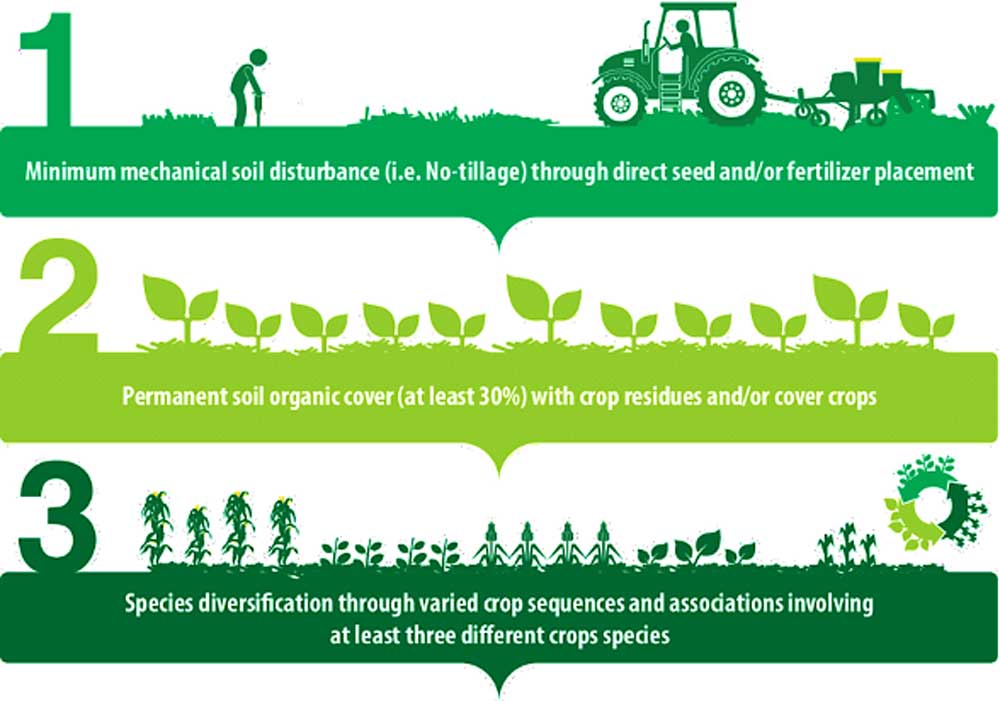
Figure 2- The 3 Principles of Conservation Agriculture. Source: FAO (2014) ‘The 3 Principles of Conservation Agriculture’, FAO Infographics - Food and Agriculture Organisation of the United Nations, (January), p. 3.
What was the rationale for starting the experiment?
Most studies on Conservation Agriculture (CA) use a traditional, narrow scientific approach, where only one variable changes during the experiment. While minimising the variables that change within an experiment may be good scientific practice and an excellent method for answering specific questions about individual mechanisms of a system, it is not well suited to evaluating large, complex systems such as agricultural systems. As such, much of the previous literature is not realistic of the real-world situation where the management requirements of agricultural systems vary considerably. For example, when a farmer transitions to CA, typically, there will be changes to the crop rotation, agronomy, and farm machinery. Thus, assessing agricultural systems using traditional scientific methodologies can result in one, or potentially both, systems being managed in a sub-optimal way. Therefore, future research needs to draw on multi-disciplinary research, such as Farming Systems Research (FSR), to work with all of the stakeholders in a farming system to collect the economic decision-making data to help farmers and agronomists to make evidence-based business decisions for productive and sustainable agriculture.
How is the experiment run?
The experiment that I started for my PhD has now been running for 5 years and is ongoing, was set up at a 9.5 ha experimental site near Whitchurch, Shropshire (UK) on Shavington and Cloverley Estate. It comprises a systematic 24 m multi-strip blocked design of CA and conventional crop production (CON); each system is independently managed by agronomists who make all the crop management decisions based on regular field observations. This means that the agronomy, crop management and crop rotations are different between the two systems year on year. Both agronomists are competing to have the most profitable system, and therefore, all decisions are made with this in mind. Data is collected on crop growth and yield, soil health and function, agrochemical risk, greenhouse gas emissions, and system economics.
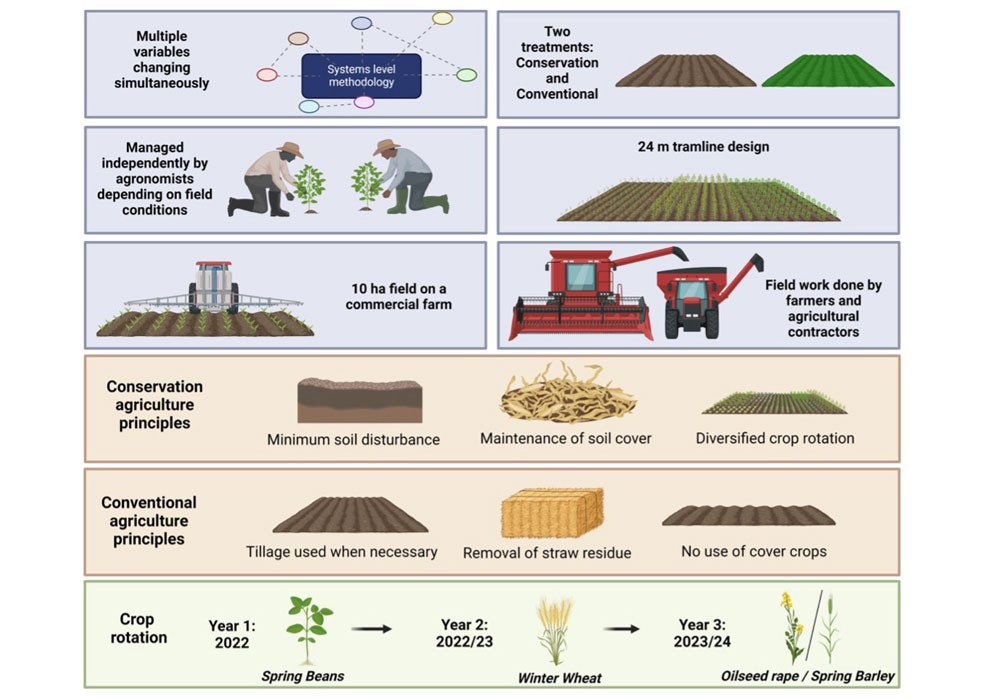
Figure 3 - A schematic of the experimental design. Source: Authors own.
The agronomists are only constrained by the following principles that they must follow:
Conventional Agriculture (CON): | Conservation Agriculture (CA): |
|---|---|
1. Tillage: Ploughing and cultivation to be performed ahead of crop establishment when judged necessary by the agronomist, using conventional methods. | 1. Tillage: No tillage to be used at any stage. All crops to be established using a low-disturbance direct drill (e.g., John Deere 750A or equivalent). |
2. Residue management: Cereal straw to be baled and removed from the field following harvest; oilseed rape residues are also removed or lightly incorporated. | 2. Residue management: All straw and crop residues to be chopped and evenly redistributed over the soil surface at harvest to maintain continuous ground cover. |
3. Cover crops: No cover crops to be sown at any point during the rotation. The fields are to fallow between cash crops. | 3. Cover crops and companion crops: Where possible, diverse cover crop mixes should be sown in the autumn or spring during fallow periods between cash crops. |
4. Pest and disease control: Standard agrochemical practices are to be followed, including the use of insecticides, fungicides, and herbicides according to commercial recommendations and seasonal pest pressure. | 4. Pest and disease control: Herbicide and fungicide applications to be used according to commercial recommendations, depending on weed and disease pressure. Insecticides are not to be used. |
5. Crop rotation: A typical rotation should be followed for the region, primarily focusing on maximising profitability. | 5. Crop rotation: The rotation should include both cereal and broadleaf crops, with deliberate diversification. |
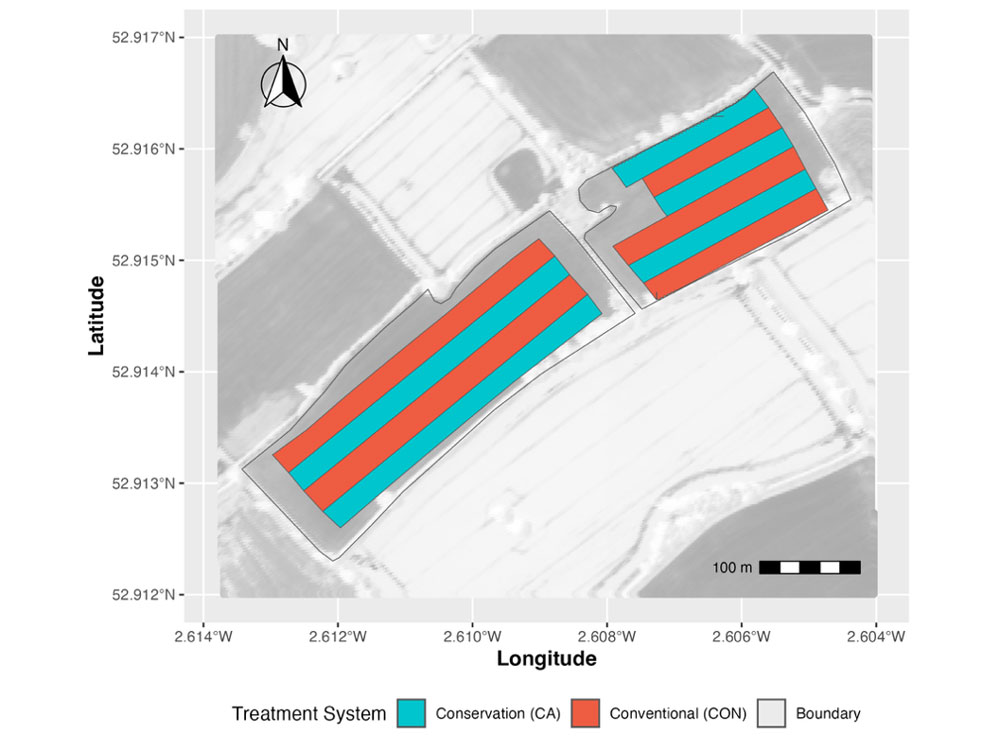
Figure 4 - Experimental design - Light blue denotes the Conservation Agriculture (CA) treatment, and red shaded areas denote the conventional agriculture (CON) treatment. Source: Author’s own.
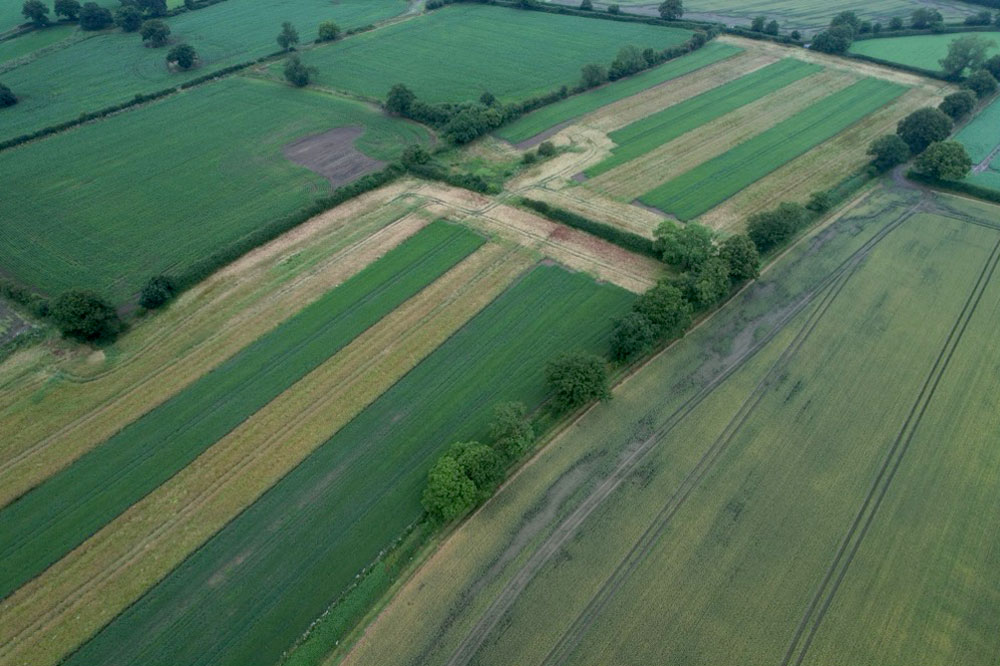
Figure 5 - A drone image of the experiment taken in 2024. Source: Andrew Watson.
What are the results so far?
Currently, we are in our 5th cropping year, and so far we have seen some significant and notable differences in the soil health and function of the two treatments. The CA treatment has a higher bulk density than the CON treatment, which is to be expected due to the lack of mechanical tillage. It will be interesting to see how this progresses over time as the natural processes of plant rooting and soil biology may begin to slowly turn this trend. Interestingly, we have also seen some significant increases in soil nutrient availability in the CA treatment, which I hypothesise to be as a result of reduced offtake of crop residues. Currently, there have also been no statistically significant differences observed in the percentage achieved of the UK average yield between the CON and CA treatments.
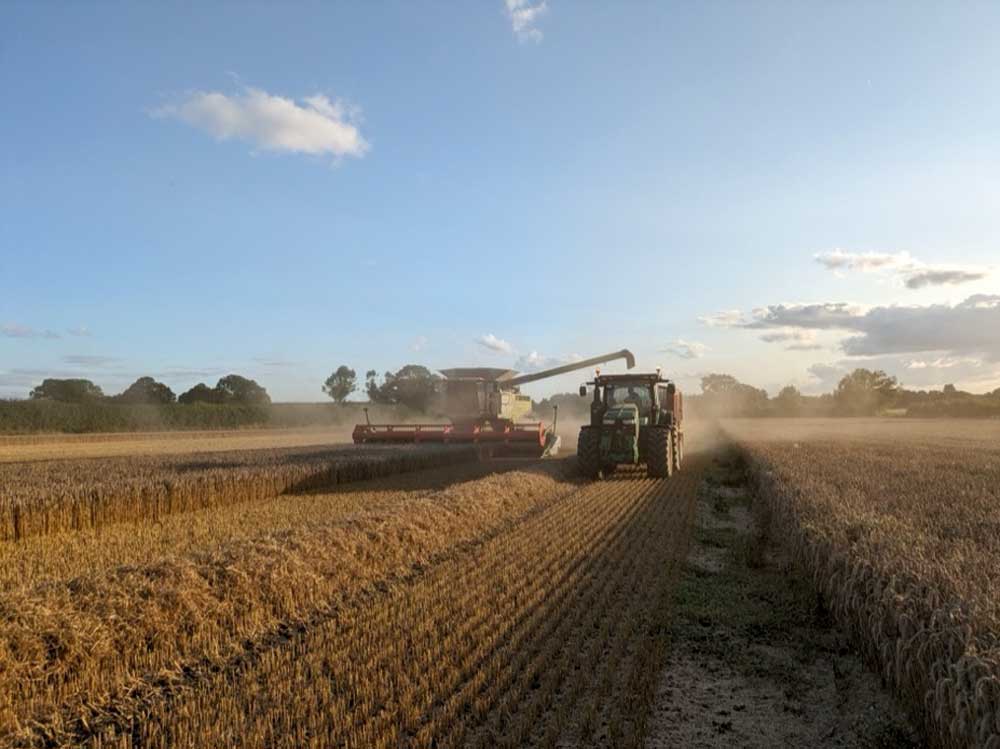
Figure 6 - A tracked CLAAS Lexion 760 with a CLAAS Vario 930 header harvesting the experiment on 20/08/2023. Source: Author’s own.
In terms of differences in agronomic management, no significant differences have been identified in total pesticide mass applied between the CA treatment and the CON treatment. However, the CA treatment applied significantly more herbicides, and the CON treatment applied significantly more fungicides and insecticides. This is an interesting finding as it shows how the two systems require different management approaches and encounter differing weed, pest, and disease pressures.
When I assessed the system economics, CA was shown to significantly reduce expenditure on machinery operations and crop applications compared to the CON treatment, whilst not reducing revenue. It also required significantly less operational passes ha−1, significantly less machinery operational time ha−1, and significantly less fuel usage ha−1, compared to the CON treatment. This is an important finding for farmers, as economic margins grow ever tighter in agriculture, reducing total expenditure and reliance on fuel and labour can result in significant savings for farm businesses as well as reducing economic risk from fluctuating commodity prices.
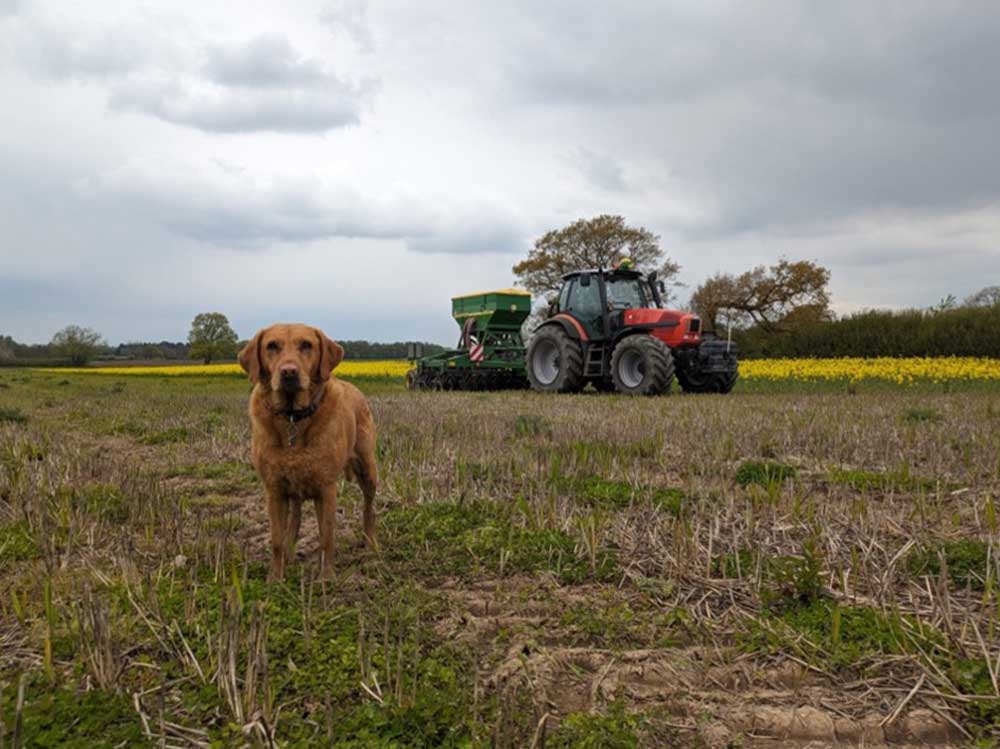
Figure 7 - My lovely dog Ruby posing in front of a SAME Iron 165.7 tractor and a John Deer 750a planting spring barley in 2024. Source: Author’s own.
How has the Earth Rover Programs “Soilsmology” been involved with your project?
Our latest academic paper “Between two furrows: soil bulk density from non-invasive seismology” was based on an experiment conducted in the Conservation Agriculture Systems Experiment. Here we conducted our seismic survey in both agricultural treatments and then took a crazy amount of soil samples to ground truth our seismic data with! Our Earth Rover Program soils team based at Harper Adams analysed all the samples for bulk density, moisture content, stone volume, and total carbon content. Our results confirmed that at ultra-high frequencies, seismic velocity correlates strongly with bulk density, confirming that ultra-high frequency seismic imaging, or as we like to call it “Soilsmology”, can resolve subtle structural differences in soil profiles related to agricultural practices. In summary, we are really pleased with the paper and are already working on the follow up – a fully 3D image of the top and sub soil of 1 ha. Which we hope will be a fantastic bit of science that demonstrates the applicability and potential of “Soilsmology” for on-farm soil management in the future. Watch this space!
Joe
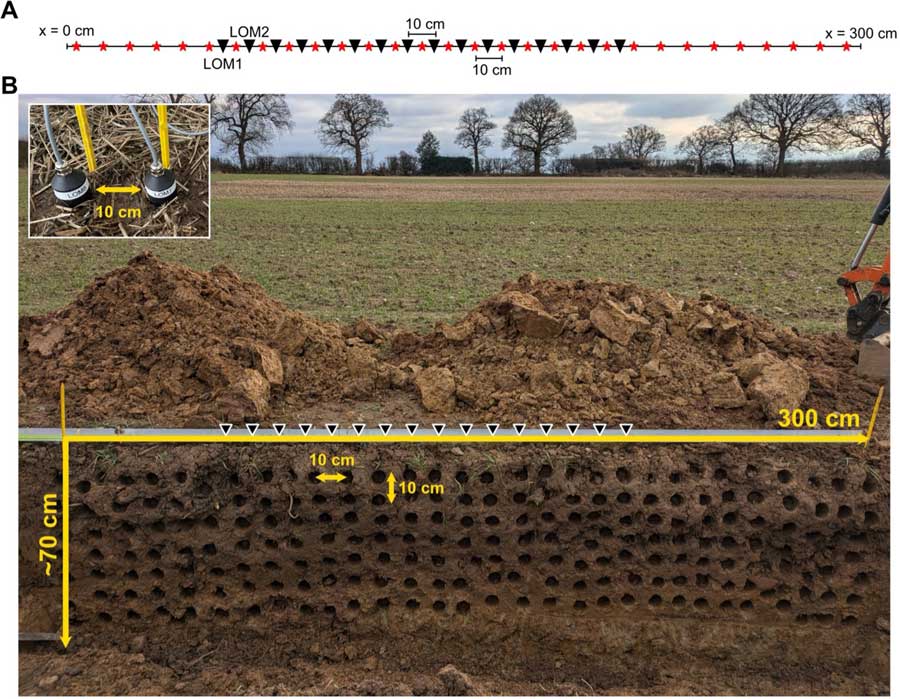
Figure 8 - A Schematics of experimental set-up. In total 16 instruments were used (black inverted triangles). The red stars show the hammer strike location. B Photograph of the detailed soil sampling which was conducted right beneath the seismic experiments (black inverted triangles with white rim show approximate location of the geophones). Horizontal yellow line measures the extend of the trench (300 cm), vertical yellow line measures the depth of the trench. In total 210 soil samples were taken, with approximately 10 cm spacing between them, and analysed for each experimental treatment. Inlay shows zoom of LOM instruments during experiment. Source: Tsekhmistrenko et al. (2025) - https://iopscience.iop.org/article/10.1088/2515-7620/ae1d27/meta#ercae1d27s4


