Seismic analysis & modelling
Seismology, the science of waves inside solid materials, is a well-established discipline both regarding the nature of seismic sources (earthquakes, glaciers, anthropological movements, animals), as well as seismic imaging. At this stage, we focus on the latter, essentially applying cat scans of the inaccessible subsurface. We thereby employ evidence-based inference on subsurface parameters that are sensitive to a range of soil health functions. We work along the entire pipeline of seismic analysis: Bespoke experimentation in the field, proto-type sensors, automated data processing, active seismics and passive time-dependent monitoring, a range of inversion methods, uncertainty analysis, machine-learning, and seismic modelling. We integrate this research with AI, our survey sites, geophysical and soil analysis.


Data processing
Seismic data processing pipelines have enjoyed community standards and widely used open-source software packages such as ObsPy. We leverage and fully incorporate these efforts. A key focus is automation: From picking seismic traveltimes (a measurement of a waveform), to denoising, stacking, deglitching, quality control, uncertainty propagation and imaging, we strive to deliver an open, transparent and reproducible pipeline to achieve quasi-realtime inference from waveform to image. An example of automated traveltime picking below.

Ultrahigh frequency wavefields
In order to use seismic wavefields and existent analysis packages at the decimeter scale, we examine whether subsurface materials and surface conditions are characterized by known wave physics (e.g. linear elastodynamics) for seismic waves propagating from a defined source and recorded by an adequate sensor.

Seismic modelling
210 soil cores taking from the cross section dug up after seismic surveying. This is needed, along with weeks of lab work, to achieve the same resolution in subsurface bulk density as we do in a 1-hour seismic experiment followed by semi-automated data analysis without any soil disturbance.
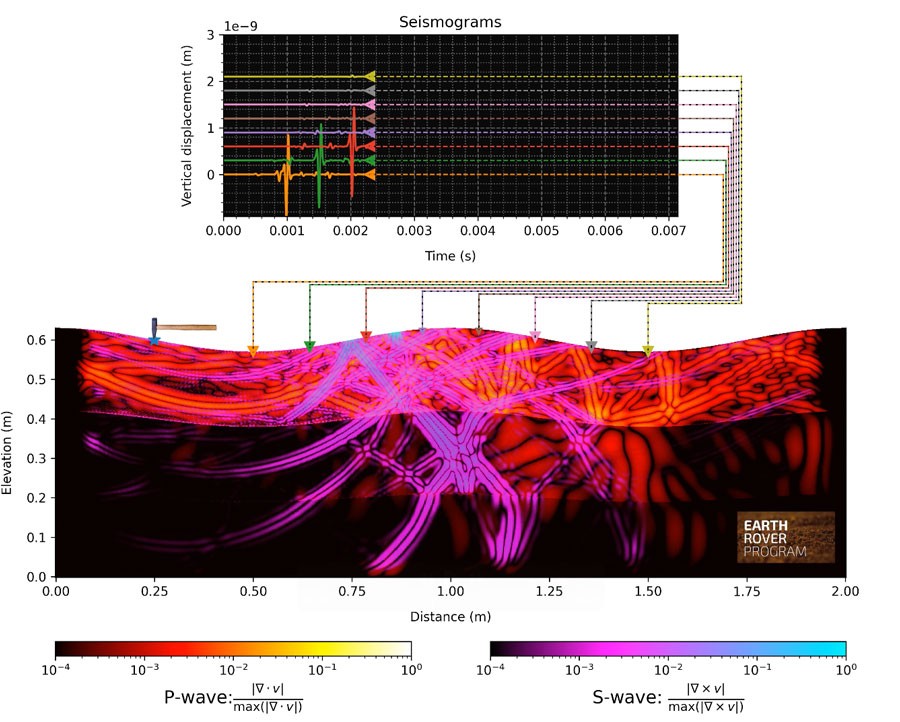
Shaker is an interactive tool that brings underground vibrations to life. It shows how seismic waves—like those created by a hammer strike or a small earthquake—travel through layers of soil and rock. What normally happens invisibly beneath our feet becomes a vivid movie: waves spread, bend, reflect, speed up, or slow down depending on the subsurface. At the same time, virtual sensors record the ground motion just like real seismometers, helping users understand how scientists interpret seismic signals.
Behind Shaker is our new in-house numerical modeling framework based on a distributional finite-difference method, a next-generation approach that outperforms traditional spectral-element and finite-difference schemes. This high-accuracy solver allows ERP to reproduce and interpret field seismic data with exceptional fidelity, improving our ability to link observations to soil structure and behaviour.
A major achievement is pairing this advanced physics engine with a simple, intuitive graphical interface. Users do not need to understand stability conditions, CFL limits, or other technical settings. With only a few clicks, anyone can build complex soil models, launch simulations, and compare synthetic seismograms with field recordings. To our knowledge, no existing scientific software offers a GUI of this kind for elastic wave-propagation modeling.
References:
Distributional finite-difference modelling of seismic waves
Y Masson
Geophysical Journal International 233 (1), 264-296
Y Masson, J Virieux
Geophysics 88 (3), T165-T183
Can we activate seismic sources to excite seismic waves at those frequency ranges that encode topsoil properties? Are those source excitations repeatable, yielding detectable signals? Which field-deployable sensors can be coupled to the ground in a consistent, repeatable manner, recording wavefields suggestive of linear propagation regimes?
In the image above, wavefields recorded from active agricultural land have been filtered in various bands between 200-2000Hz, indicating stellar data quality and linear propagation regimes (with no visible spectral broadening, or evidence for non-linear wave energy). The wave types (P, S, surface waves) are typical in seismology and can each be used to create seismic images of the subsurface.
Seismic imaging and inversion
Using the high-quality, ultra-high frequency wavefields that can resolve soil properties, we solve inverse problems to create tomographic images of the subsurface. The figure below shows refraction tomograms in Vp velocities for P-wave inversions (bottom), against soil coring for bulk density. The correlation coefficient over depth is above 95%, indicating that seismic imaging can retrieve bulk density at depth without destroying the soil, at a fraction of time and cost.

Seismic images (bottom) against bulk density cores analysed in the lab (top), extracted from the soil as seen in the image below. Left: Conservation agriculture; Right (10m away from the conservation field): Conventional tillage agriculture.
210 soil cores taking from the cross section dug up after seismic surveying. This is needed, along with weeks of lab work, to achieve the same resolution in subsurface bulk density as we do in a 1-hour seismic experiment followed by semi-automated data analysis without any soil disturbance.
Further soil parameters that are crucial for soil health are currently investigated, including moisture, porosity, connectivity, topsoil depth, texture and carbon content. Most of these have been measured seismically at a variety of different scales.

Modelling
In order to better understand seismological field data and their sensitivity due to a variety of soil parameters and functions, it is inevitable to simulate seismic wavefields. We have built an in-house modelling apparatus with an easy-to-use app to manipulate input parameters. Our in-house expertise in modelling is deep: numerical methods developed and published by ERP team members throughout their careers have become established open-source science community tools, spanning modern finite differences, spectral element, and Lattice-Boltzman methods, as well as physics-informed machine-learning simulation. Wavefields are simulated for realistic soil models, including topography, undulating horizon depths, 3D variable structure, elastic, acoustic and porous media, and inclusion of small-scale objects such as roots or rocks.
Future directions
Seismic analysis will further examine how specific soil properties is sensed by seismic waves. This includes moisture, porosity, connected porosity, texture, and by inference soil carbon, contamination of soils by toxins, as well as hydrological features such as aquifers and groundwater.
We strive to build a digital twin with a large, modelled database of waveforms with known background structure. We are in the process of building a controlled laboratory environment to conduct experiments in simplified soil layers (sand, clay), and measuring seismic and soil properties in situ. We are continuously assessing wavefield features and their relation to soil properties, including small-scale objects such as rocks, cavities, roots that manifest themselves in seismic 3D scattering, as well as passive monitoring and noise environments. We are working on uncertainty quantification in a Bayesian framework, and on employing a variety of inversion schemes such as surface-wave inversion, full-waveform inversion, Bayesian causal inference, and physics-informed machine learning inference. We are always open for collaboration on these topics.